Projects

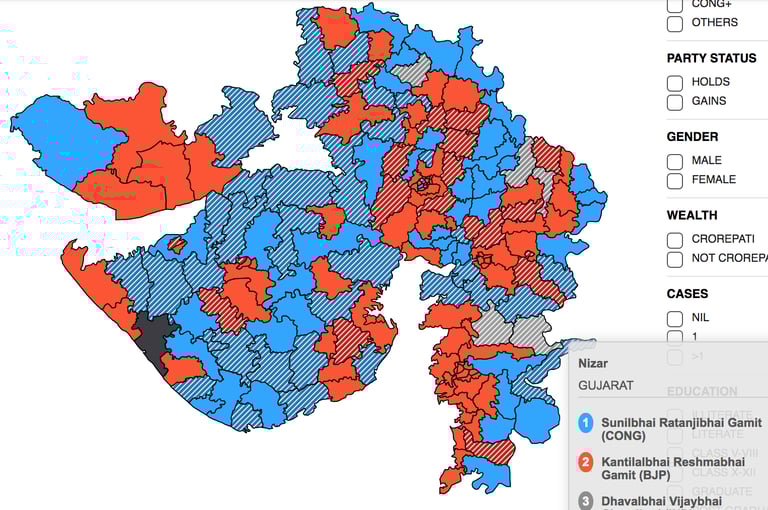
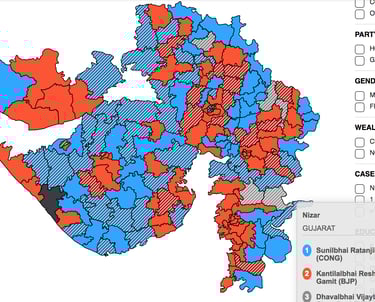
Mapping voter shifts with GIS precision.

Voter Trends

Tracking shifts in voter demographics.

Political leaders engaging with local communities using voter data insights.
Leader Support

Tools to boost leader-voter connections.

Interactive dashboard showing voter participation rates by region.
Close-up of a voter matrix index chart with colorful data points.
Participation

Enhancing democratic engagement levels.

Data Insights

Comprehensive voter data analysis.

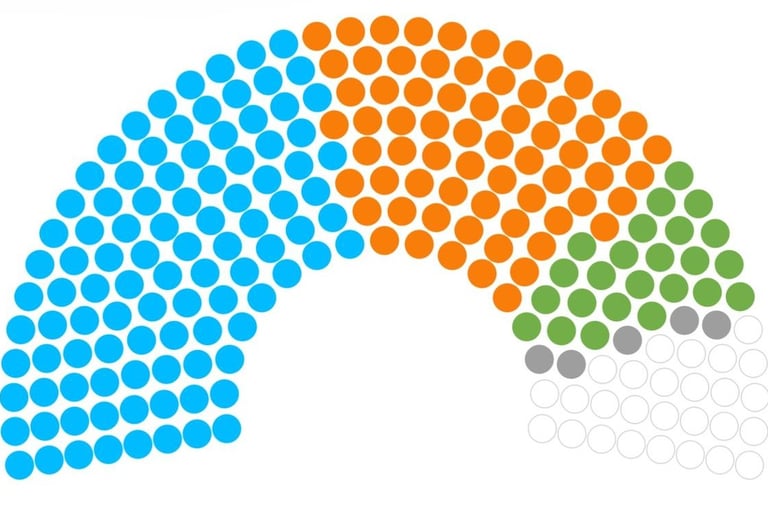
Understanding Voter Dynamics

At Signett, we blend demographic shifts with GIS technology to empower political leaders and voters alike.

150+

15

Trusted Experts

Proven

Insights Unveiled

Mapping voter trends with precision and clarity

A detailed GIS map showing voter density shifts across Indian states.
Color-coded demographic heatmap highlighting age and gender distribution of voters.
Political leaders engaging with community members during a local election campaign.
Interactive dashboard displaying voter participation rates and trends over time.

Contact Us

A professional consultant discussing voter data maps with a client in a modern office.

Reach out to Signett for Tailored Political Consultancy and Voter Insights.